Everything I like to check before switching the radio on: the state of the Sun, the ionosphere and the magnetic field, updated live.
Now
Kp–
SFI–
X-ray–
Loading NOAA data…
Data source: NOAA SWPC
Band conditions
Estimate per band, day and night, for Europe (N0NBH / hamqsl.com):
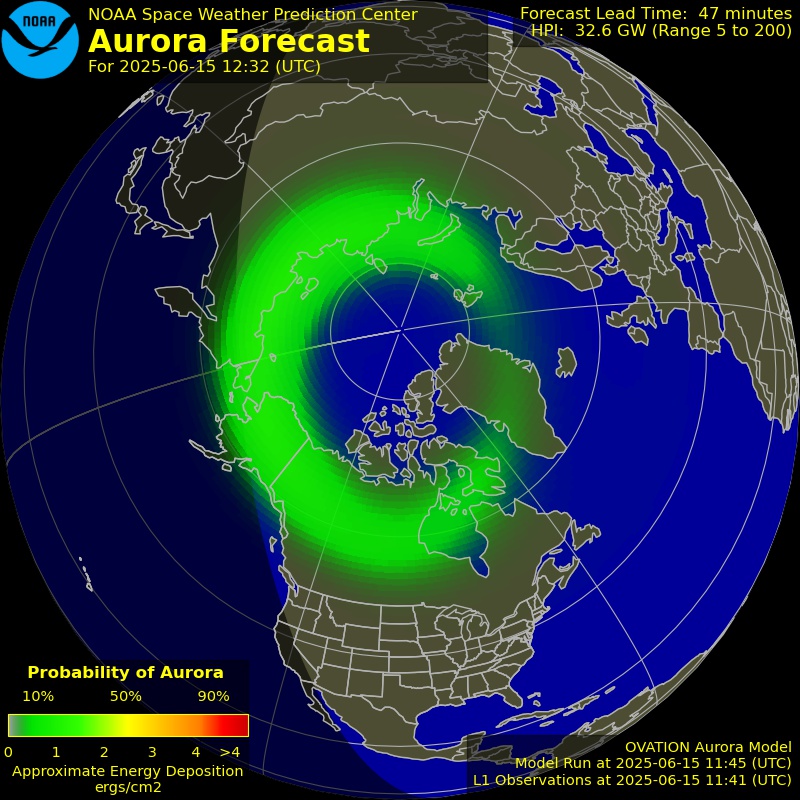
Maps and graphs


How to read these values
- SFI (10.7 cm solar flux): the higher it is, the more ionised the ionosphere gets by day. Below ~80 only the low bands work well; above ~120 15 m and 20 m open nicely; above ~150 10 m does too.
- Kp (0–9): measures how disturbed the Earth’s magnetic field is. Up to 2 is quiet; from 5 (G1) there is a geomagnetic storm, with noise and fading at high latitudes and a lower MUF.
- Solar X-rays (classes A, B, C, M, X): an M or X flare ionises the D layer on the sunlit side and absorbs HF, causing a radio blackout that can last minutes to hours, stronger on the low bands.
- MUF: the highest frequency the ionosphere reflects on a given path. Above it the signal escapes to space; below it, it is reflected. It pays to operate a little below the path’s MUF.
- D-RAP: where and how much the D layer is absorbing HF, by frequency. Handy to understand why a band “dies” during the day.
The values in this panel are read in your browser from public services; if one fails, the links below lead to the source.
Tools
- NOAA SWPC — the US space weather prediction centre
- SpaceWeatherLive — real-time indices and alerts
- VOACAP Online — point-to-point predictions by hour and frequency
- KC2G — MUF/foF2 maps and an HF path planner
- PSK Reporter — who is being heard, on FT8 and other digital modes
- Reverse Beacon Network — automatic CW and RTTY spots
- WSPRnet — WSPR beacons worldwide, to test the path
- DX Heat — DX Cluster spots on a map
- NCDXF/IARU — beacon network on 14, 18, 21, 24 and 28 MHz
- SILSO (SIDC) — international sunspot number